I’ve been working on an application for a grant with writer, David Thomas Henry Wright (he’s really the mastermind behind the project). It’s an electronic literature proposal and it’s been quite time consuming. This is my own fault though; I wanted to create a test site as part of the project uses a Content Management System (CMS) not a lot of people are familiar with.
A content management system allows you to create and modify content on a website without any coding experience. The most popular example used by bloggers and companies is WordPress, which provides an interface that makes it easy to add and update information.
An introduction to Omeka
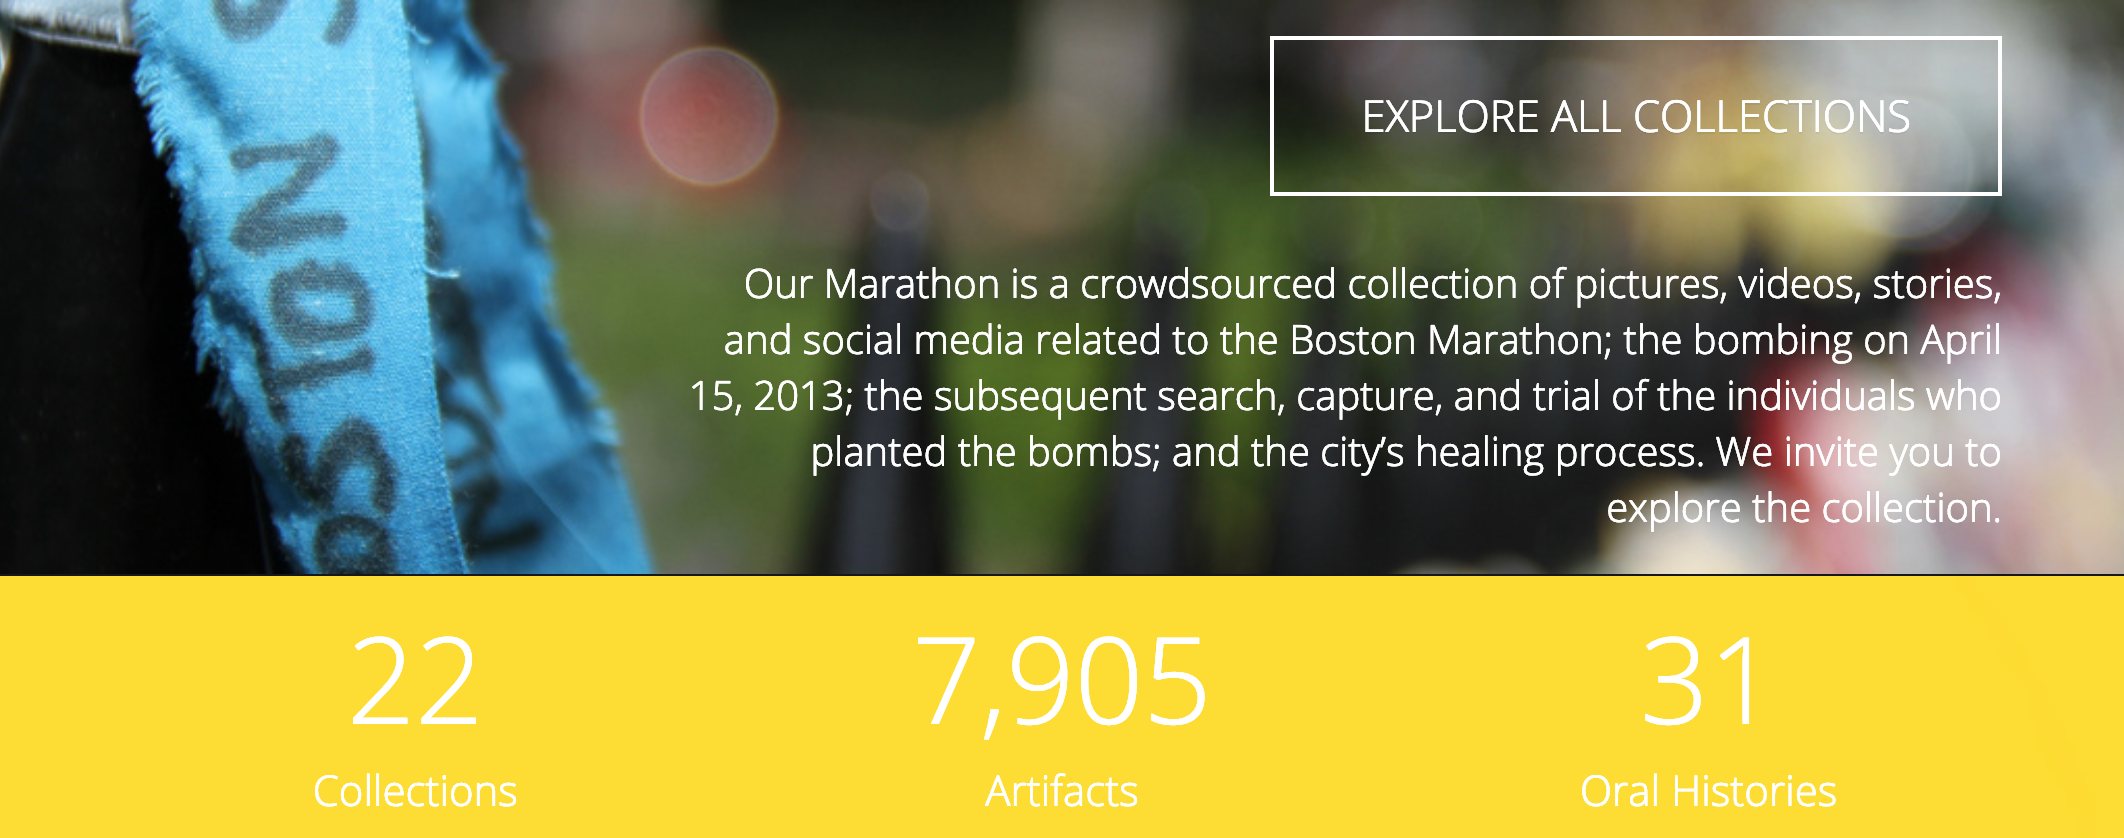
The project I’m working on will be using a CMS called Omeka, which was developed to provide a platform for academics in the humanities to catalogue data. Basically, it provides an interface you can use to create digital collections and exhibitions. A great example of this are the archives from the Boston Marathon, which are made up of crowdsourced pictures, videos, stories, and social media posts relating to the Boston Marathon bombing.
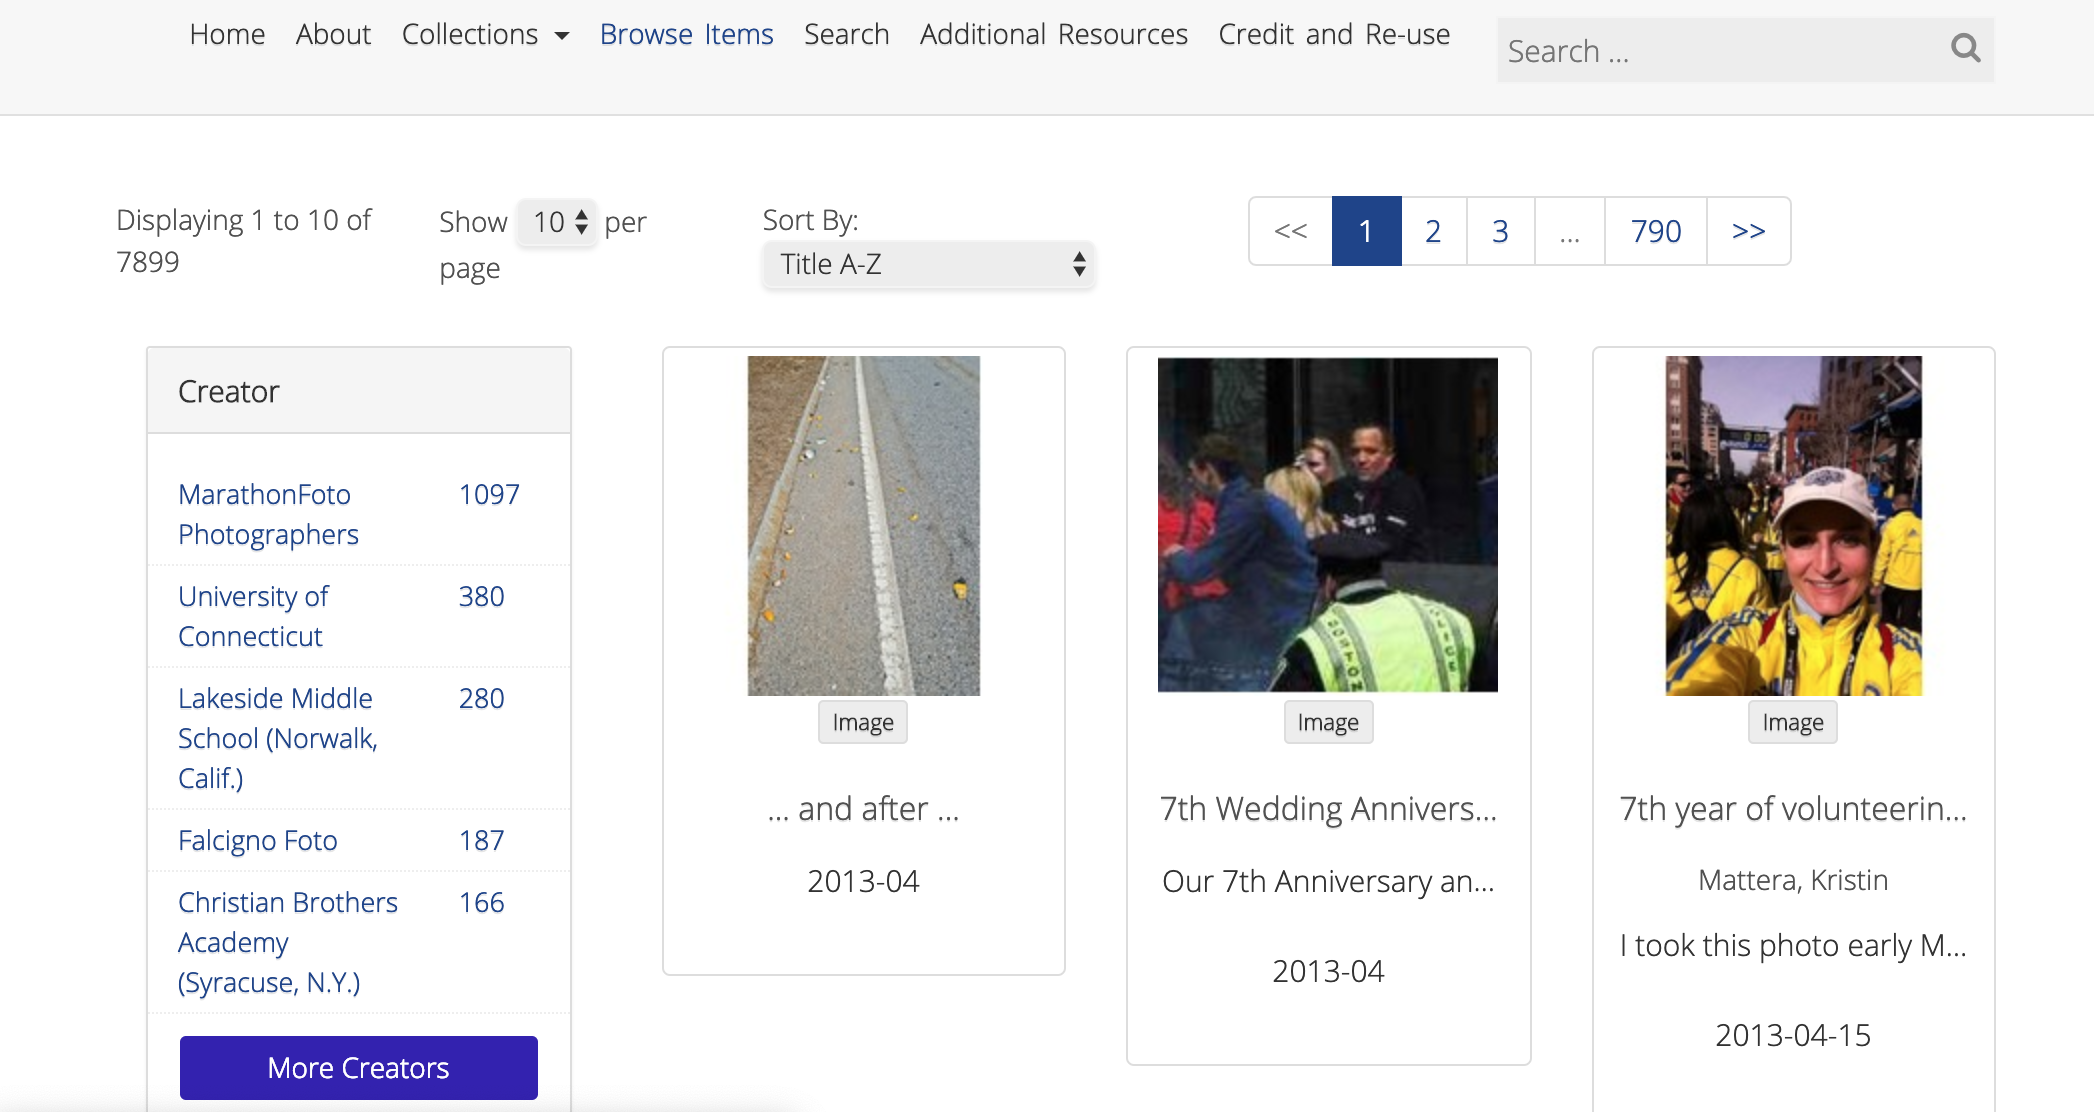 Omeka is great tool to use to create a database like this as, when you add an item to a collection, you can add data on the item itself (such as descriptions of what is in the image) as well as metadata (such as where the photo was taken). The term ‘metadata’ “refers to data about that data”(Schoch, 2013, para. 4). Basically, metadata is how the thing came to exist.
Creating maps and timelines with Neatline
While Omeka allows researchers to curate digital collections, it’s still not always that accessible – especially when there are a very large number of entries.
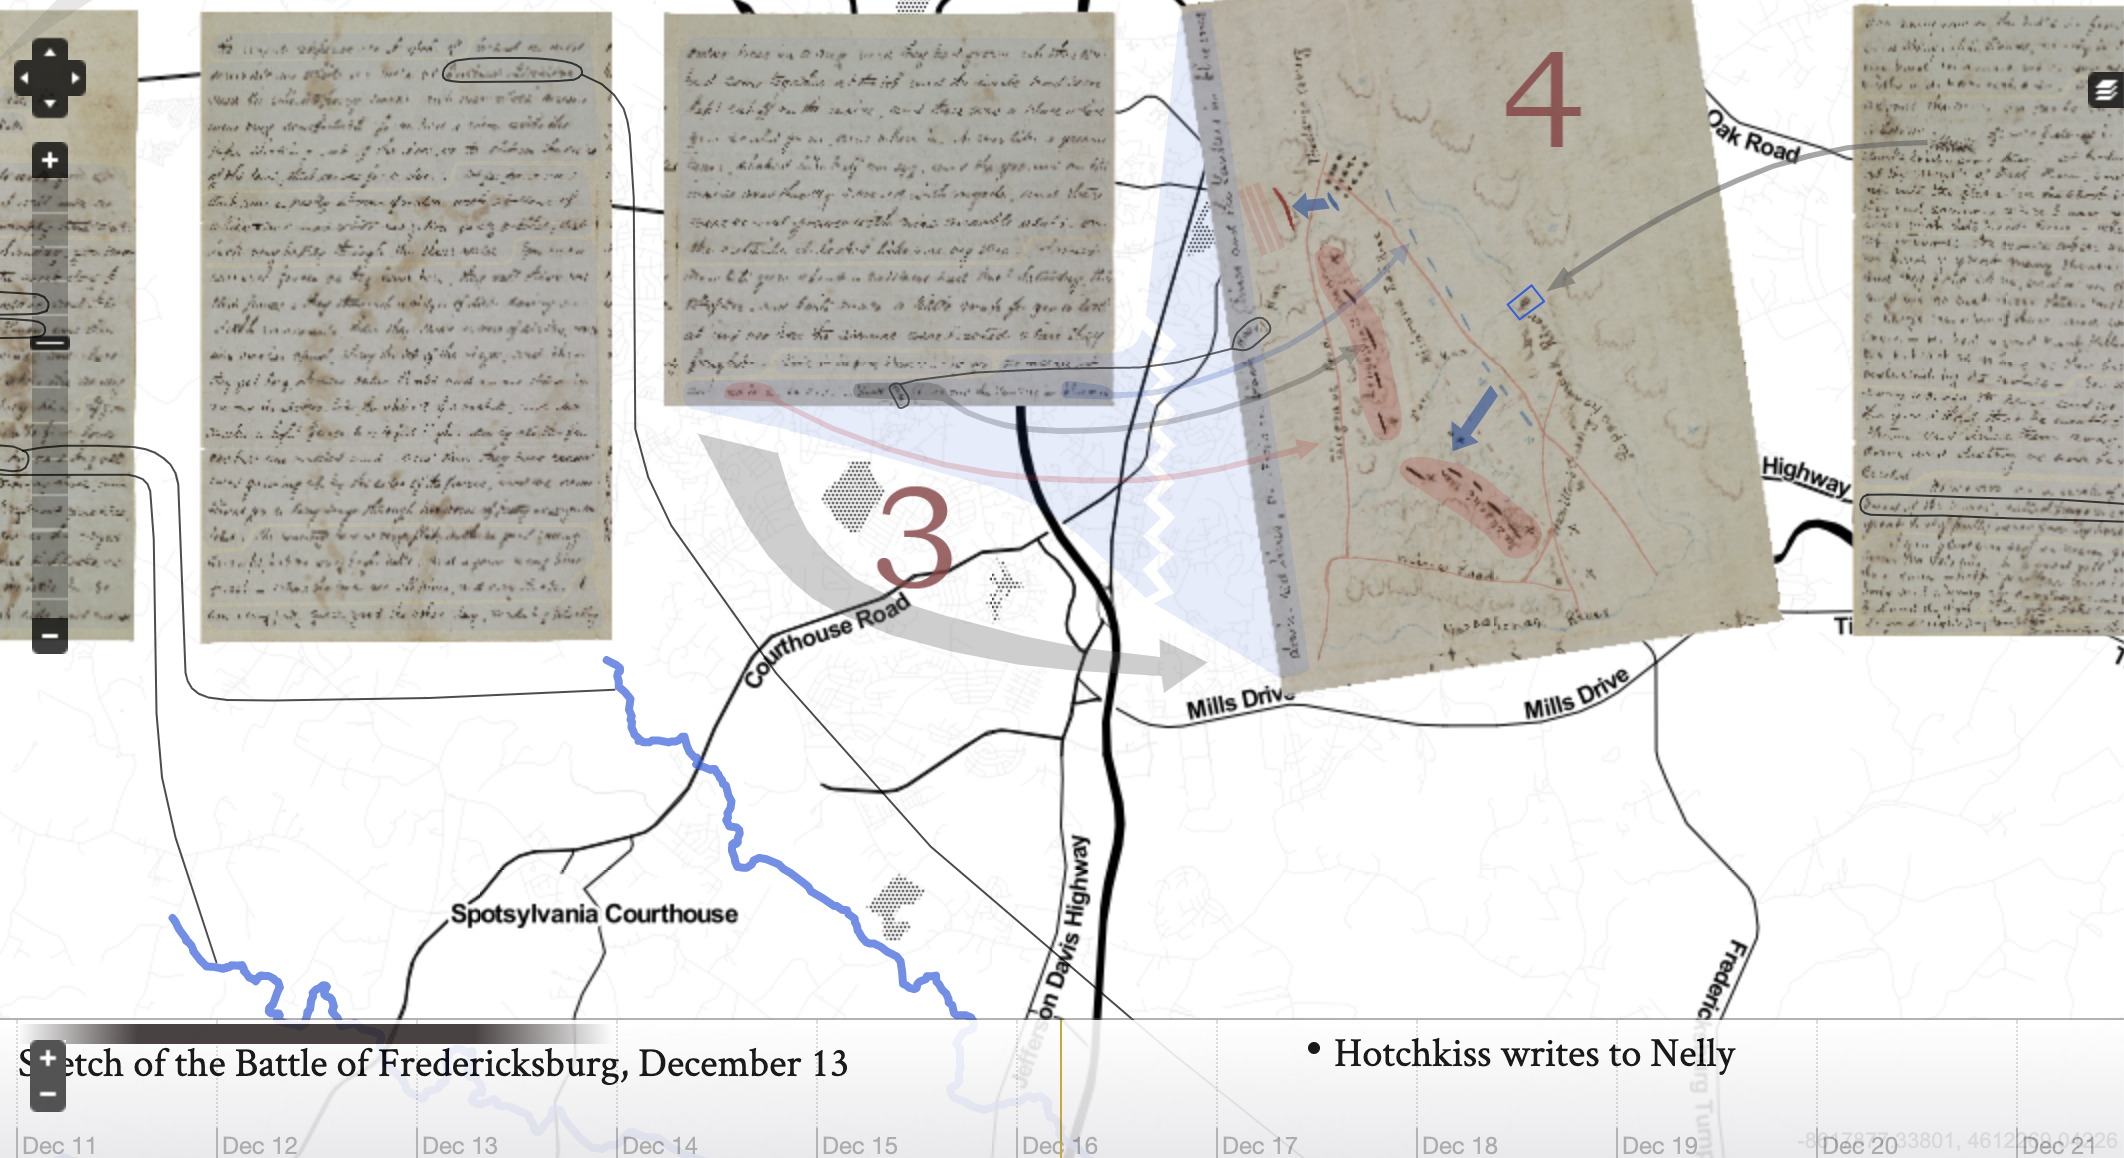
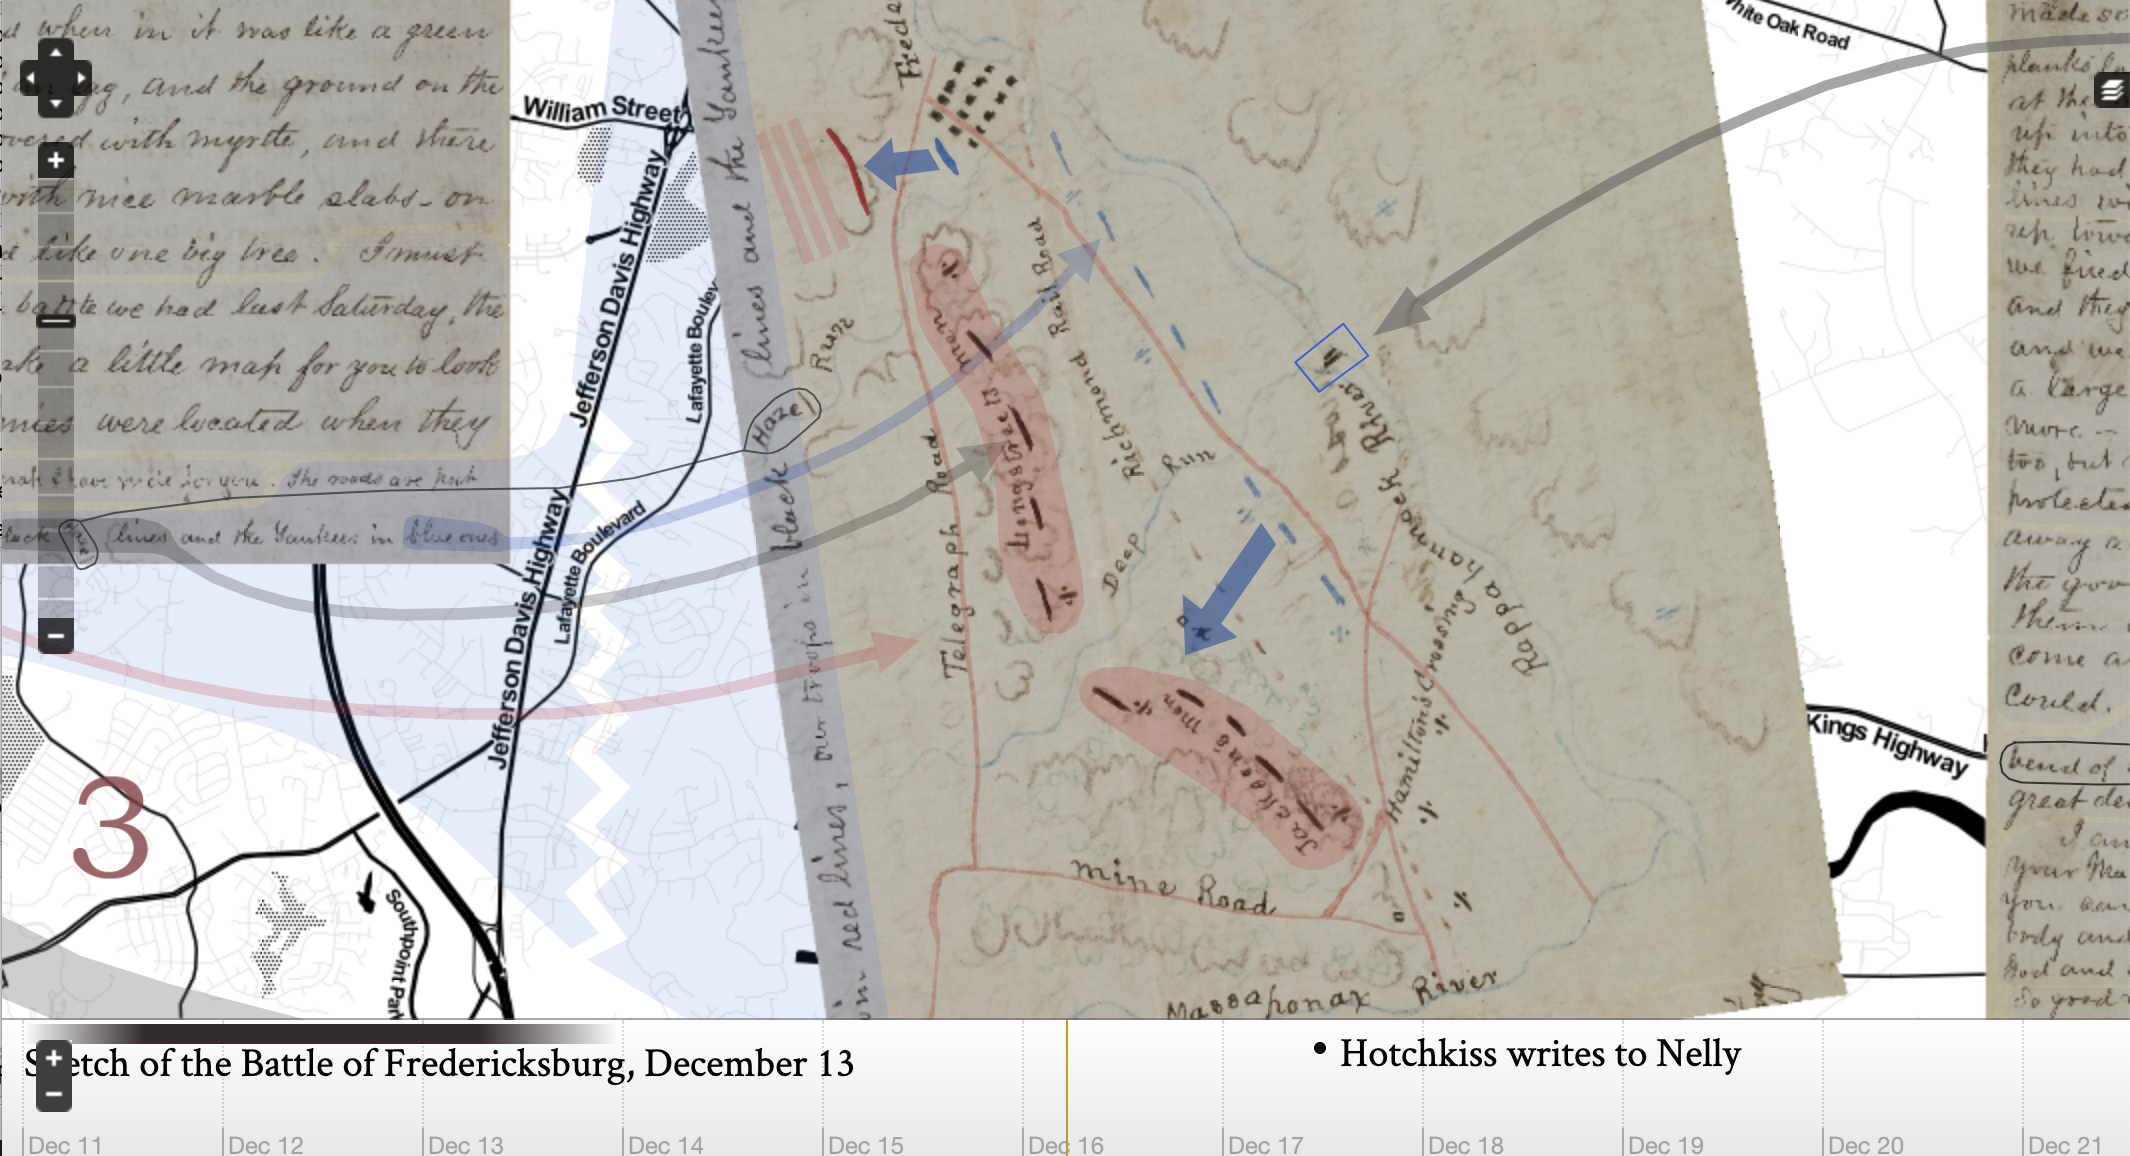
This is where a plugin called Neatline comes in. Neatline allows researchers to sort this information chronologically using a timeline, and/or spatially, using a map. A great example of this is “My Dear Little Nelly”: Hotchkiss Maps the Battle of Fredericksburg for his Child. The project contexualises a collection of civil war letters written by a soldier to his daughter by overlaying on them on maps of the battlefield.
Neatline comes into the market at a time of great change in the digital humanities. The software tries to provide a solution to how inaccessible research can be.
Essentially, Omeka and Neatline are tools that focus on what the humanities does best, using small amounts of data to tell stories (this is as opposed to big data, which refers to datasets so large a standard computer application cannot process them. Learn more about it on newdata.ai):
“Not all data is big. Digital humanities scholarship likewise values the small—stories, experiences, interpretations. Scholars can use digital tools to hone in on particular objects, study their features, test different interpretations, and locate these stories even more richly in time, place, and human experience.” (Spiro, 2014, para. 16).
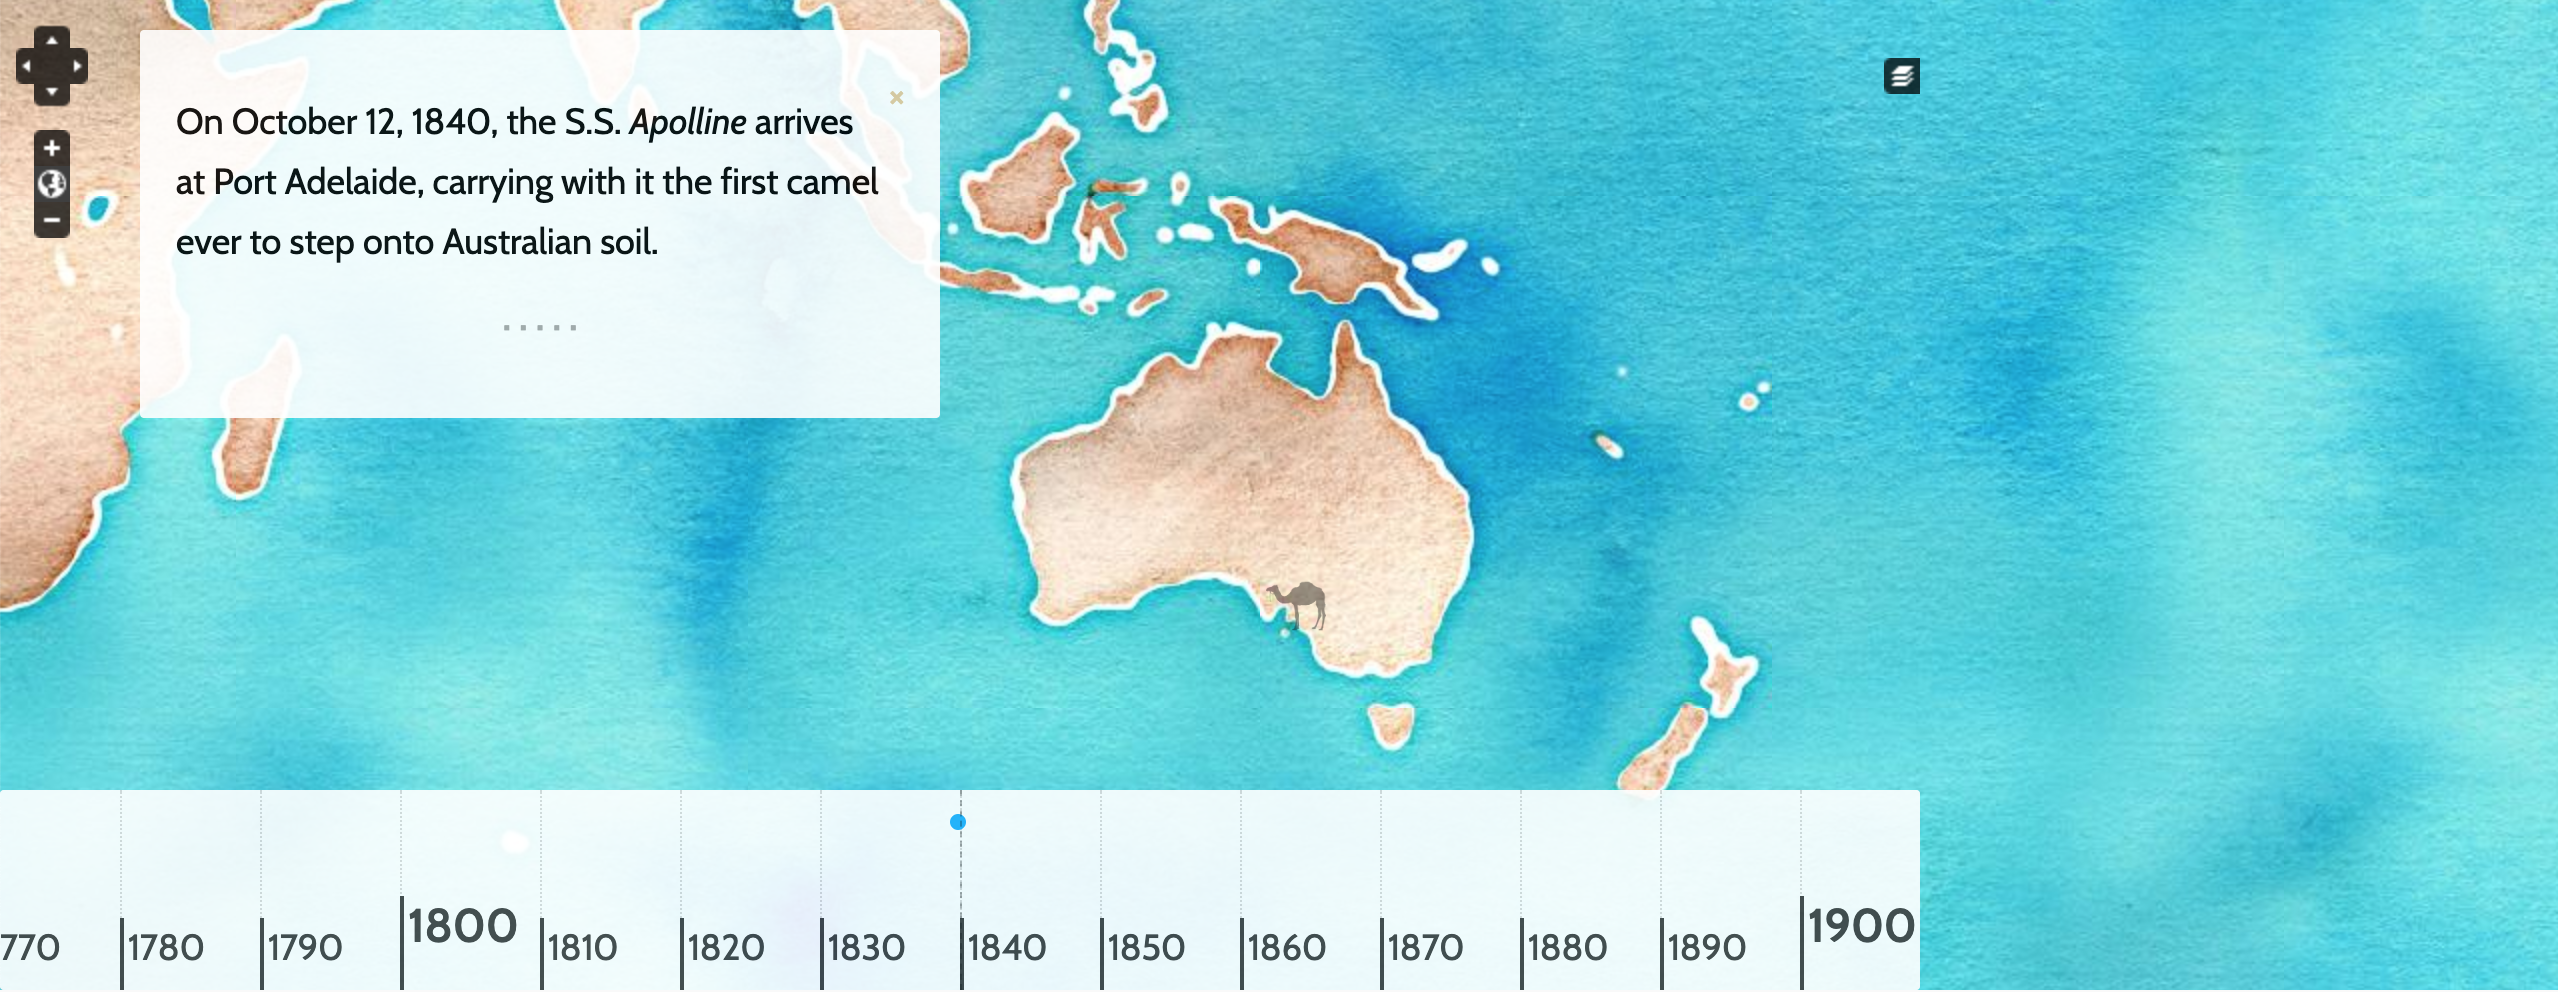
For example, the project I’ve been working on developing a proposal for looks at the history of the camel in Australia from 1840 to the present. In our work, the camel becomes a symbol to examine a much wider range of historic Australian issues, such as exploration, immigration, settlement, invasion and war.
In order to achieve this, the first thing we need to develop is a collection of artifacts that trace the history of camels in Australia. However, we also need to look for patterns in much larger datasets that could connect this history with other cultural, spatial and political histories. The resulting artifacts from this research can be overlaid onto the Neatline map along with the annotations and artifacts about camels. The screenshot below shows an early test version of one of the concepts before this data collection has taken place.
Collecting data to use in exhibits
What we are essentially dealing with here is cultural analytics – the analysis of cultural data such as visualised digital artifacts (Manovich, 2016) in order to find patterns and make connections.
While the analysis of data is more commonly applied to the sciences, it is becoming a increasingly popular research method in the humanities:
“New research is now beginning to apply these sorts of tools to the social sciences and humanities as well, and the techniques offer considerable promise in helping us understand complex social processes like learning, political and organizational change, and the diffusion of knowledge” (Johnson et al, 2010, p. 29).
However, as Schoch explains, there is still a lot of trepidation around applying these methods to cultural artifacts:
“If you ask them [his colleagues] what it is they are studying, they would rather speak of books, paintings and movies; of drama and crime fiction, of still lives and action painting; of German expressionist movies and romantic comedy…Maybe they would talk about what they are studying as texts, images, and sounds. But rarely would they consider their objects of study to be “data.” (Schoch, 2013, para. 1).
I exist in two spaces, the humanities and software development, and I still find the idea of applying big data to cultural artifacts quite intimidating. I think my concern is partly because, as Manovich explains, while some datasets are easily accessible, many aren’t (2016).
If I want to catalogue and analyse twentieth century horror films, I can search IMDb, which has an already easy to access interface. Some of the data I need to sort through for this project might not be so easy to read.
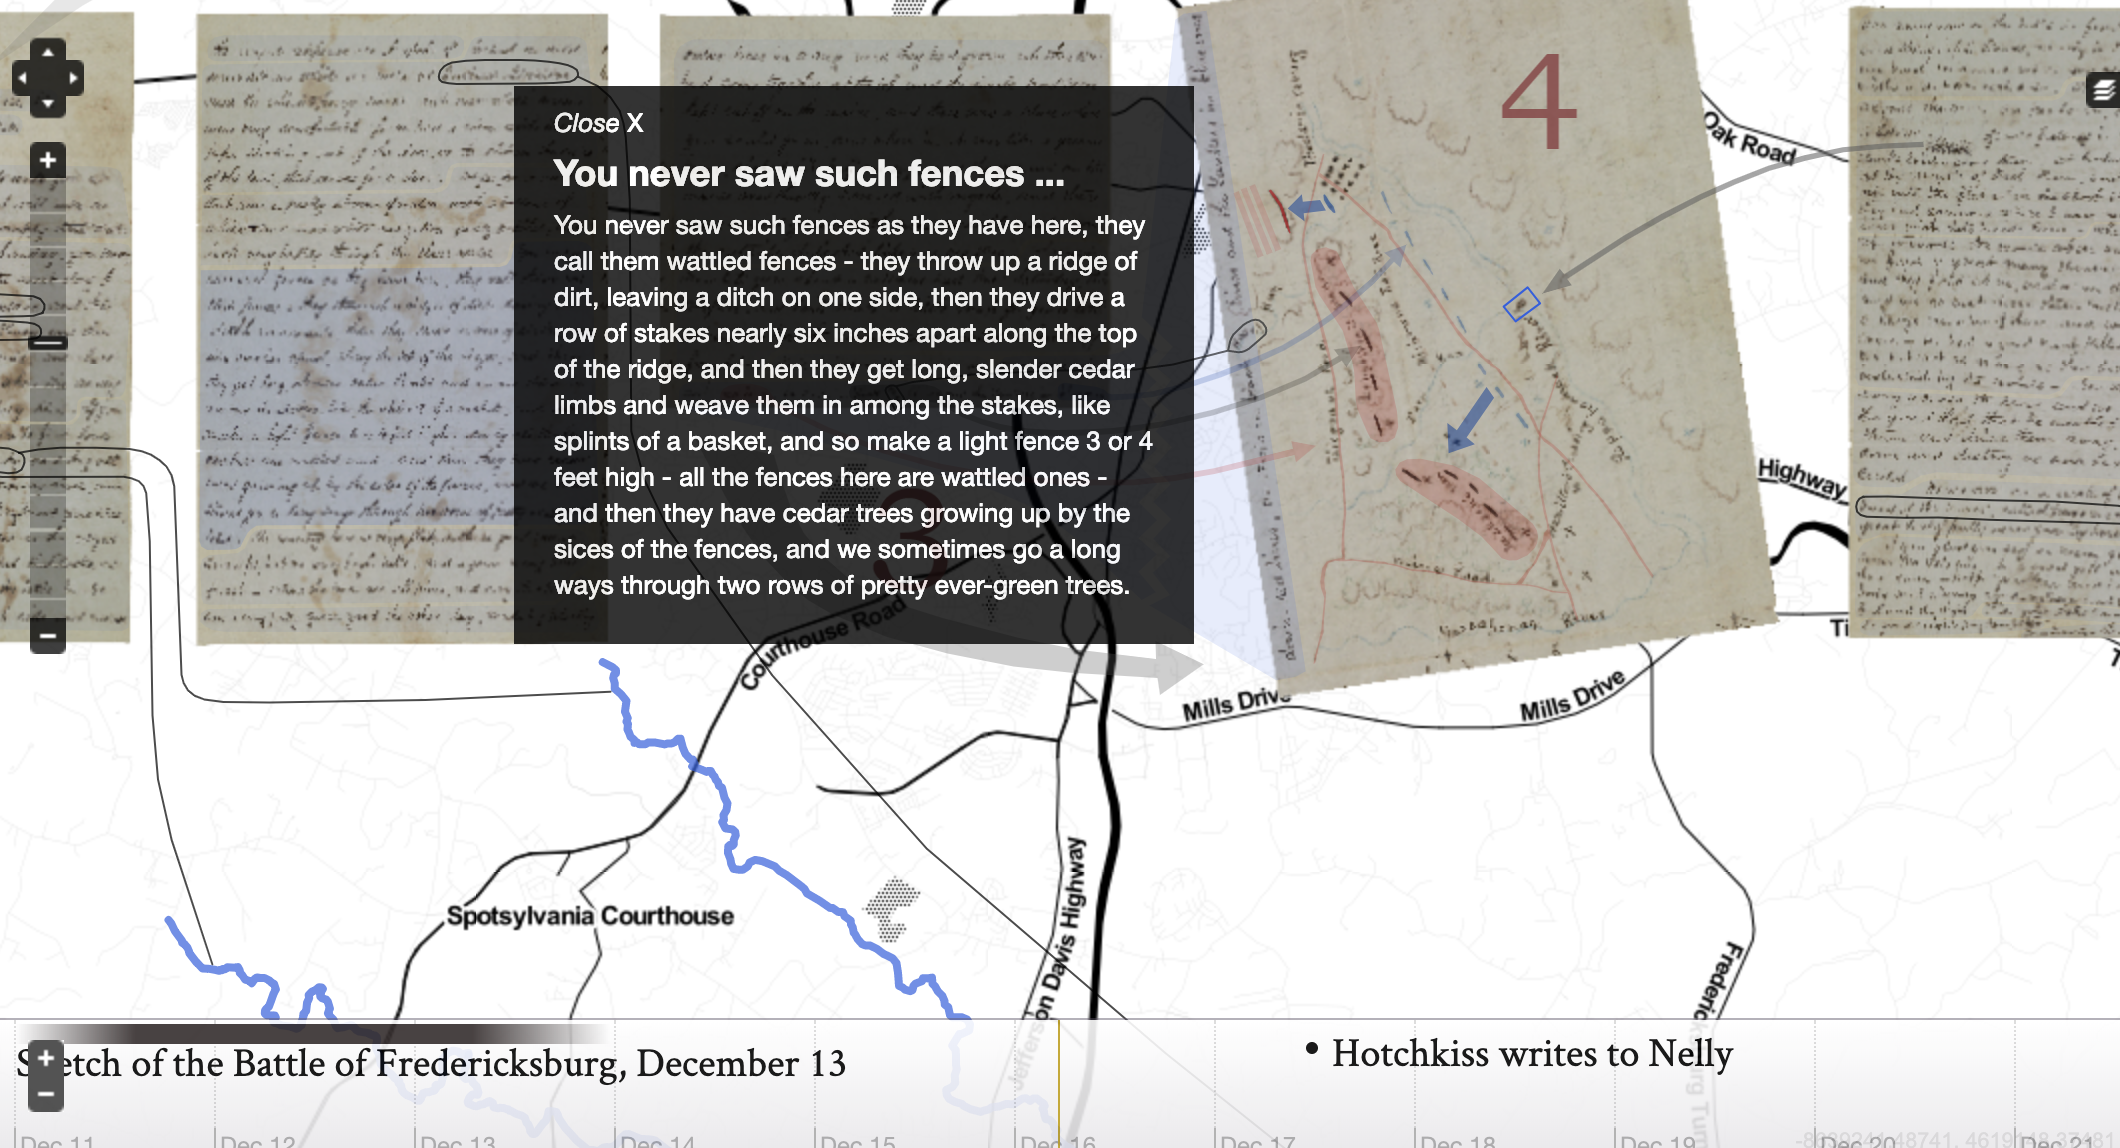
While gathering the data can sometimes be an intimidating process, finding ways to make it accessible is now much less complicated. Neatline is a tool that helps you and your readers visualise the patterns found in data, such as the connections between the civil war letters and the maps of the battles. The screenshot below shows the map on one of the civil war letters mentioned earlier overlaid onto a map of the area provided by other sources.
References
Johnson, L., Levine, A., Smith, R., & Stone, S. (2010). The 2010 Horizon Report. Austin, Texas: The New Media Consortium.
Manovich, L. (2016). The Science of Culture? Social Computing, Digital Humanities and Cultural Analytics in Journal of Cultural Analytics. Retrieved from file:///Users/karenlowry/Desktop/the-science-of-culture-social-computing-digital-humanities-and-cultural-analytics.pdf
Schoch, C. (2013). Big? Smart? Clean? Messy? Data in the Humanities in Journal of Humanities 2(3). Retrieved from http://journalofdigitalhumanities.org/2-3/big-smart-clean-messy-data-in-the-humanities/
Spiro, L. (2014). Explore, Converse: The Impact (and Potential Impact) of the Digital Humanities on Scholarship in Keys for architectural history research in the digital era (Actes de colloques) [Online]. Retrieved from http://journals.openedition.org/ inha/4925